Challenge
Harness's chaos engineering platform provided powerful resilience testing capabilities through custom experiment configurations. However, new engineering customers faced two critical barriers: understanding what types of failures they should test for in their complex distributed systems, and learning how to design meaningful chaos experiments. This technical complexity was becoming a significant blocker for platform adoption and effective chaos engineering practices.
Approach
Through conversations with our sales engineers and existing users, we developed a strategic solution benefitting all sides. We synthesized the vast landscape of failure modes and experiment types into a compact, browsable interface helping users build an intuitive understanding of chaos engineering possibilities.
Rather than just letting users create experiments via YAML scripts, we recognized the demand for a visual, no-code interface, which would help to simplify the process of creating chaos experiments. This would be especially useful for less tech-savvy customers of our platform. This insight led us to pursue a UI design that provides intelligent guidance while allowing users to construct a sample experiment through a visual interface.
Solution
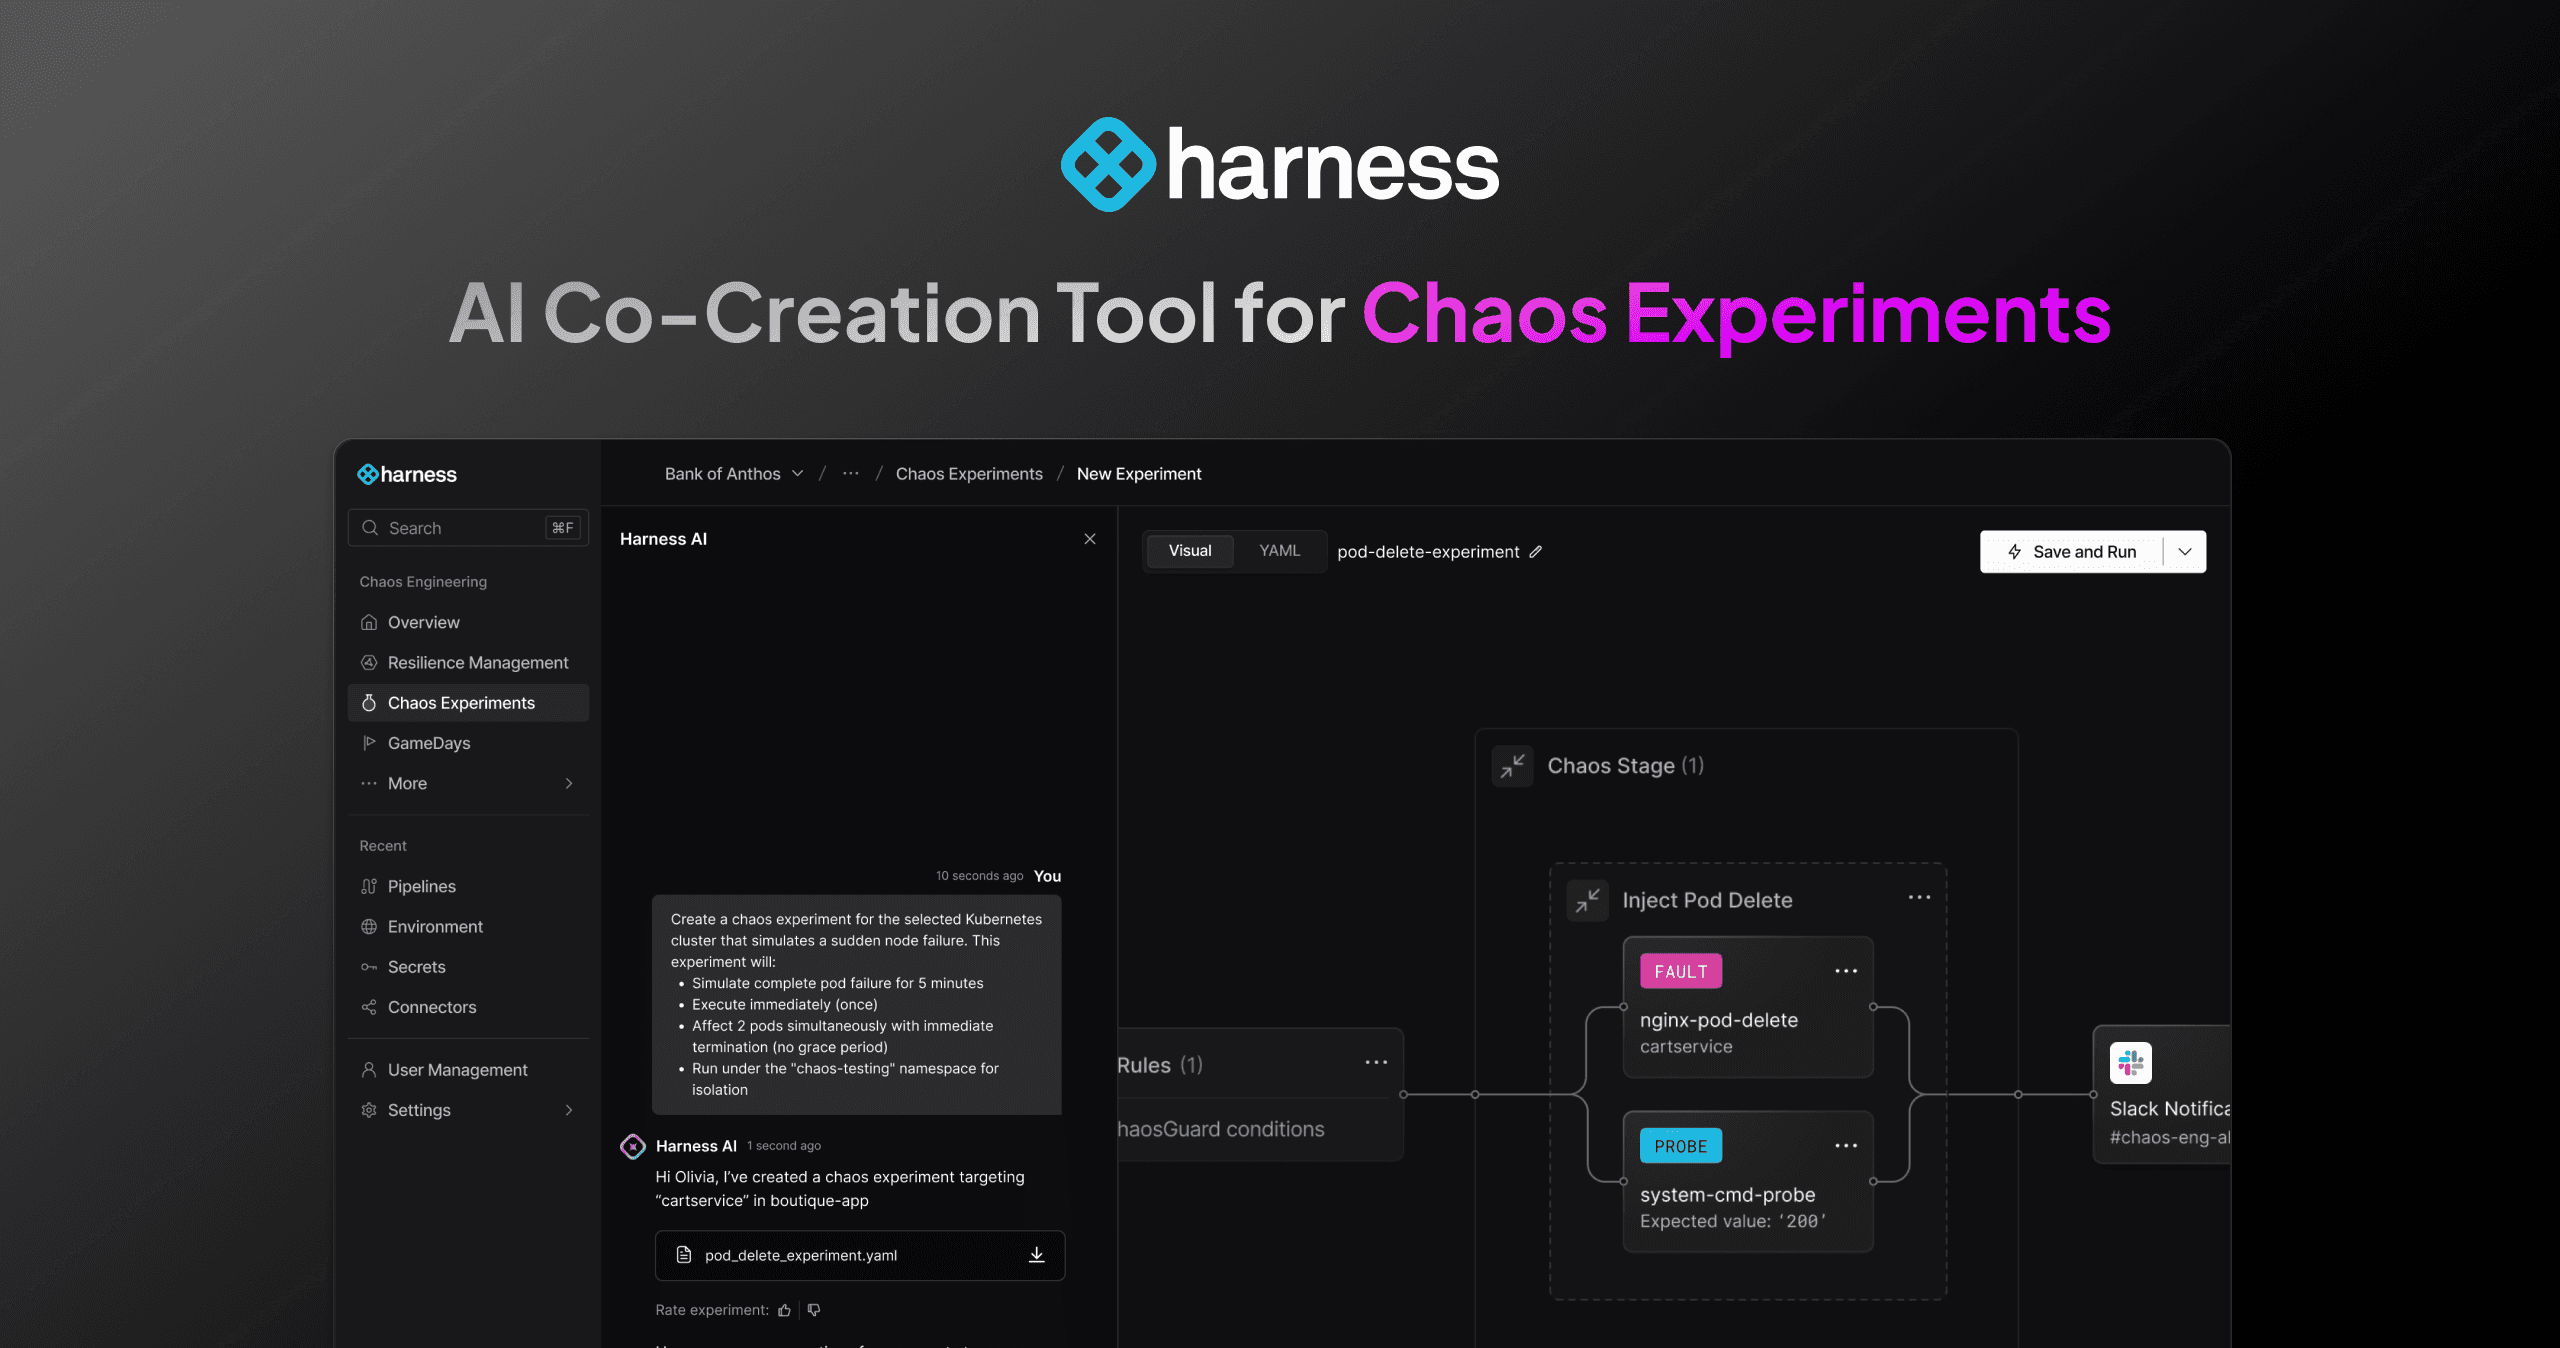
The dual AI-powered interface supported both immediate and long-term user needs through two complementary approaches:

AI Chatbot Interface:
Provided conversational guidance that made failure modes and experiment types discoverable through natural language interaction
Offered intelligent prompt suggestions that helped engineers articulate their testing goals and system concerns
Created a natural dialogue flow from basic "What should I test?" questions to sophisticated experiment specifications
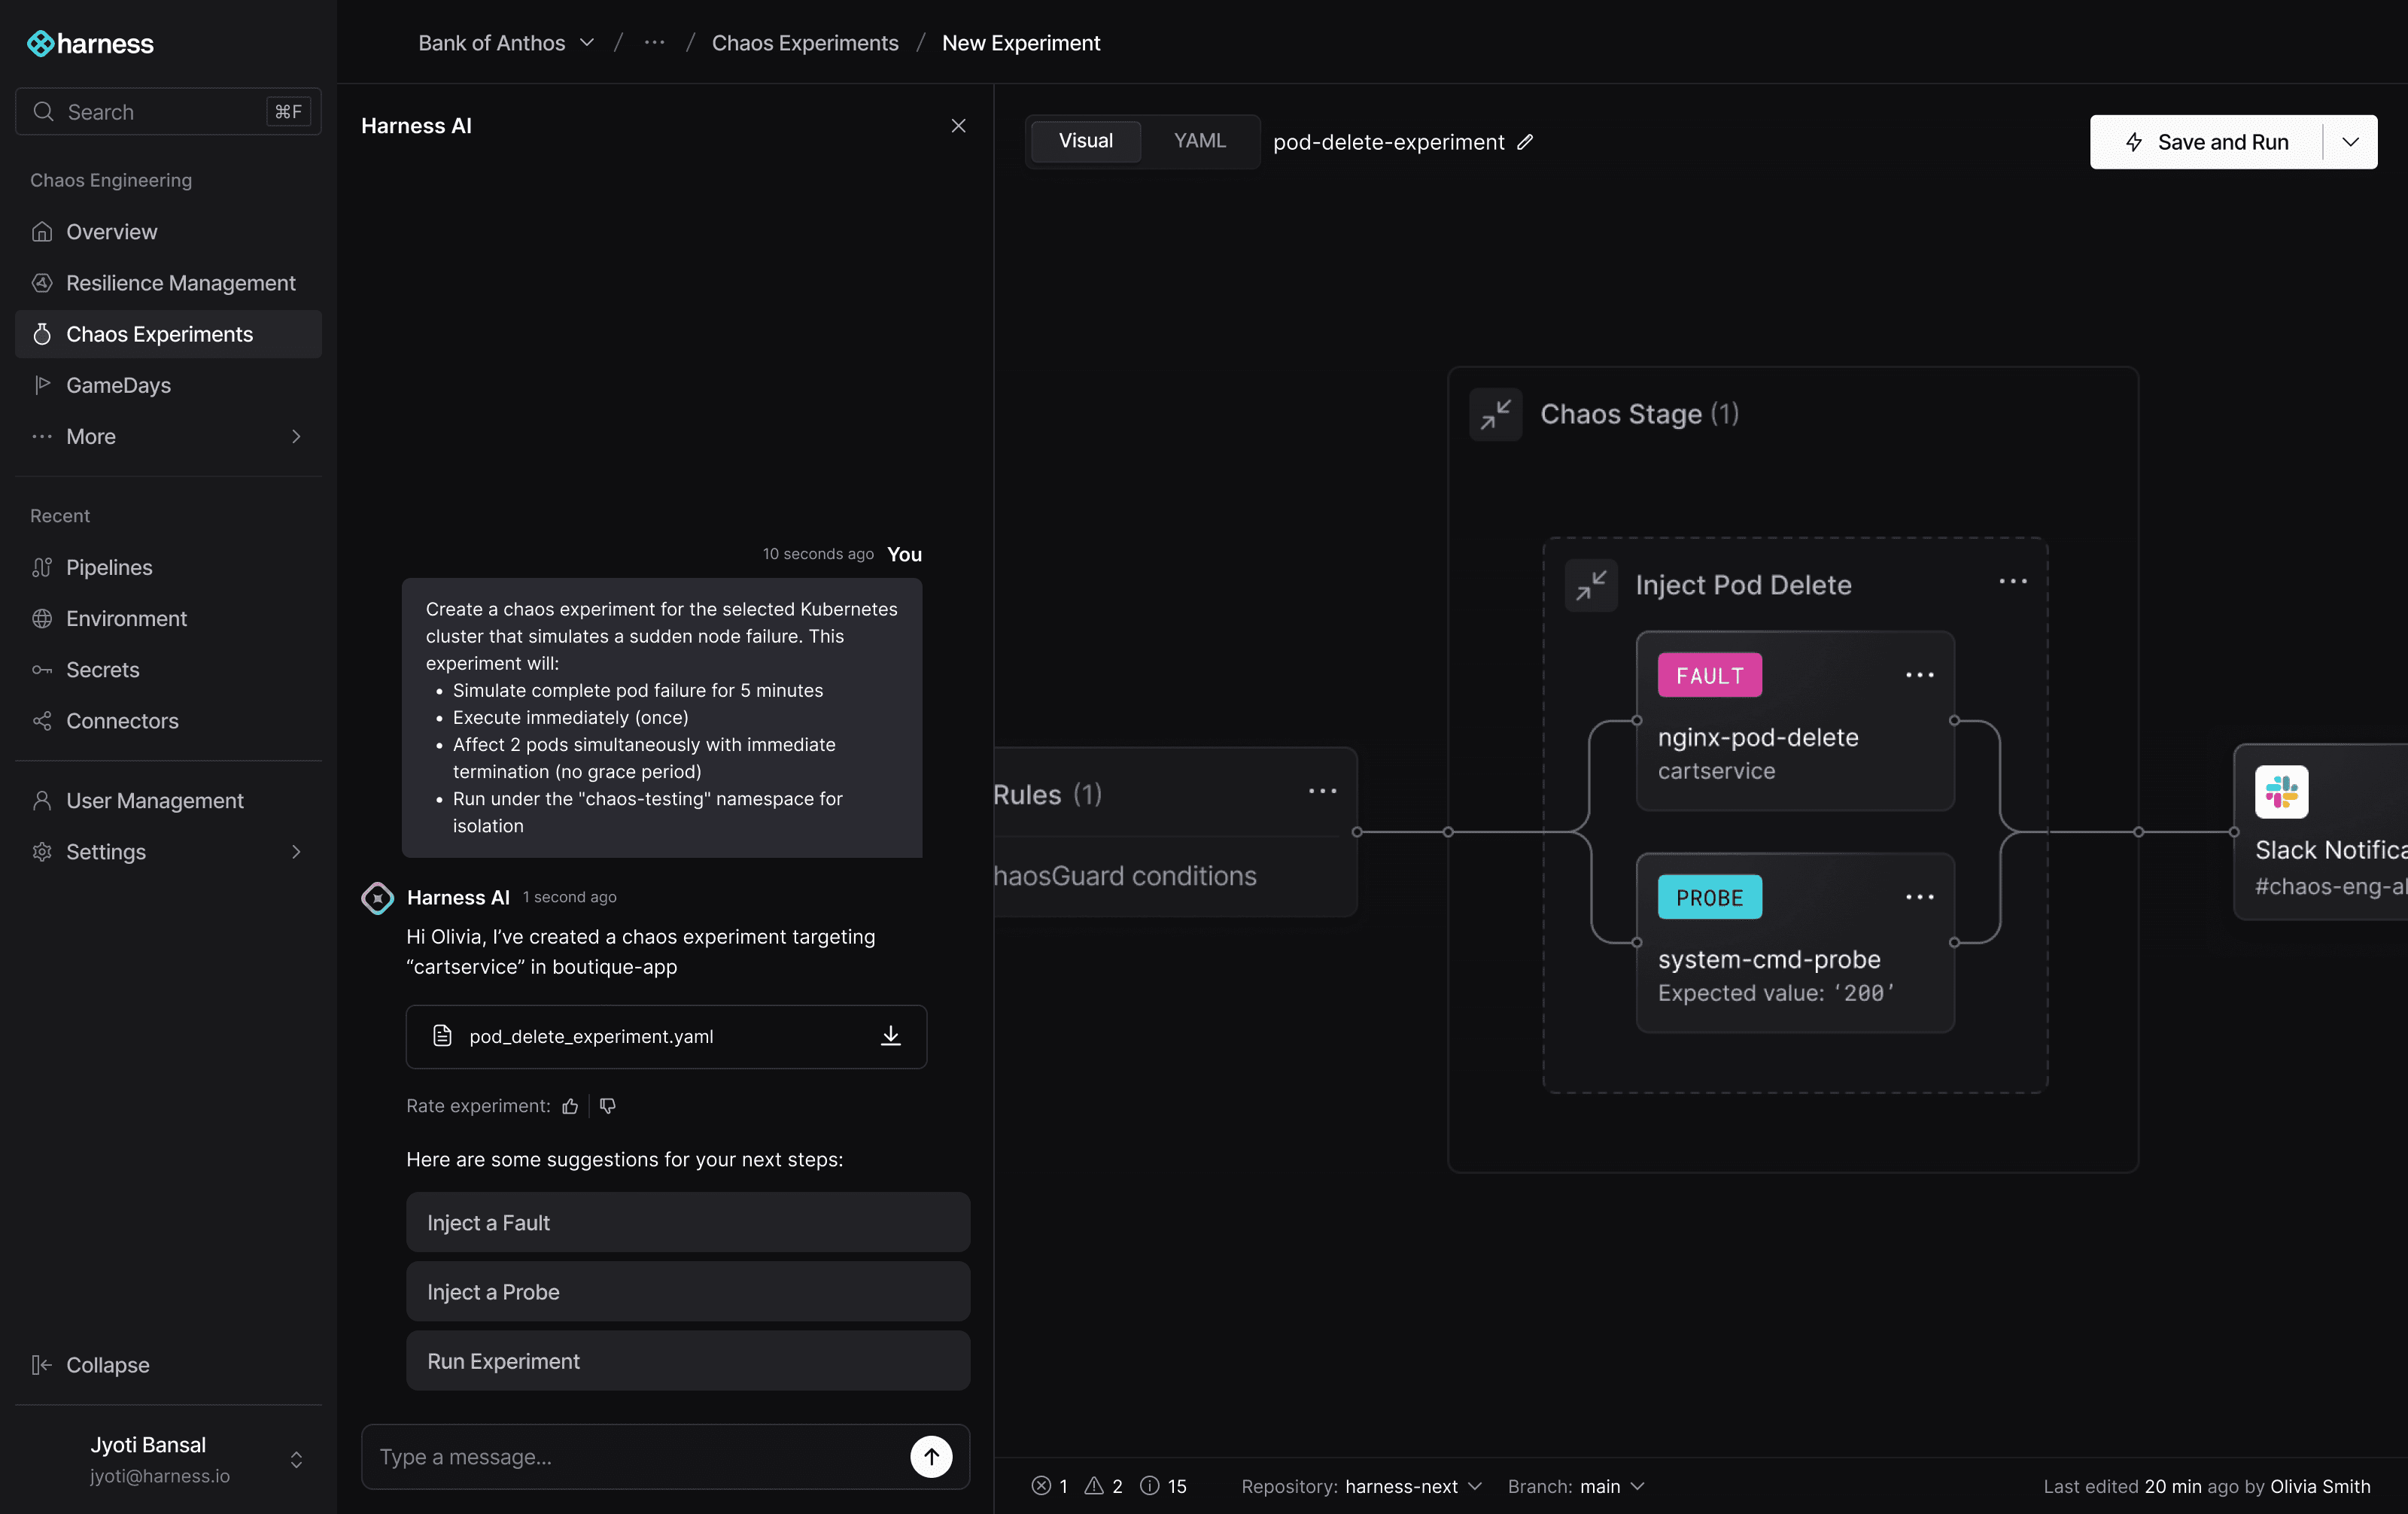
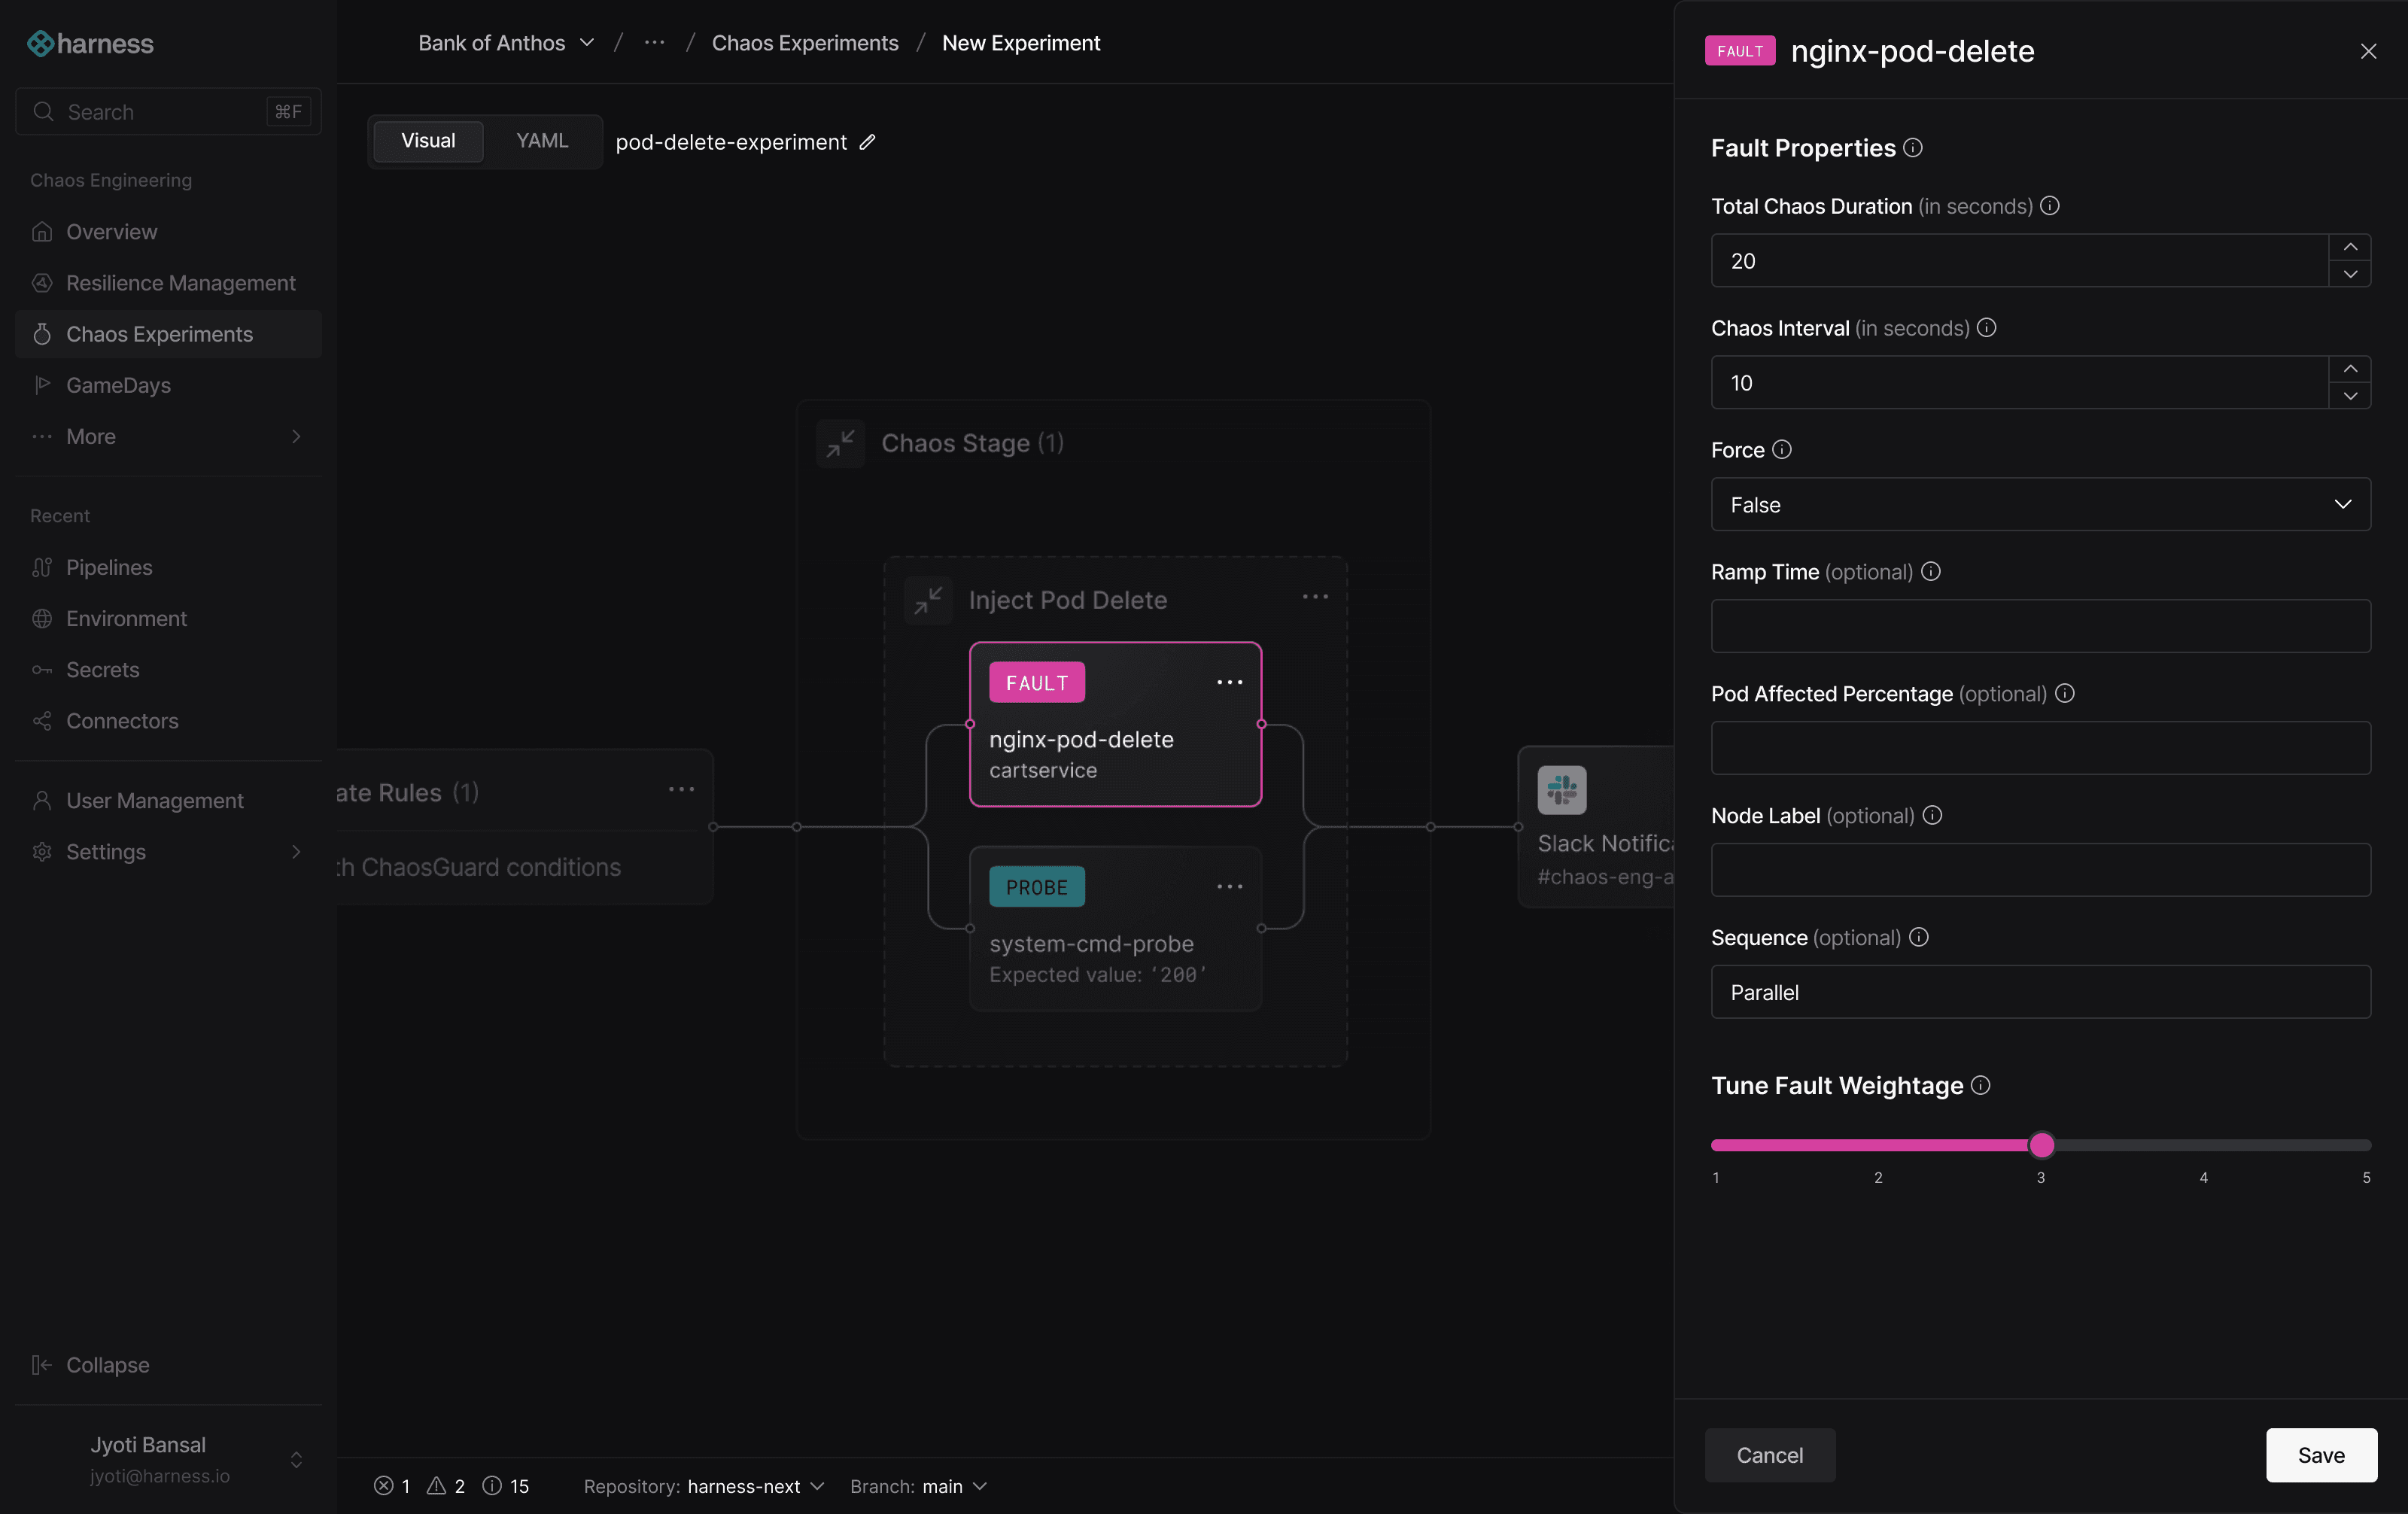
Visual Building Block Interface:
Enabled visual construction of chaos experiments using pre-built components for different failure types (network latency, CPU stress, pod termination, etc.)
Provided visual representations of system dependencies and blast radius to help engineers understand experiment impact
Offered seamless transition between visual and code interface for advanced users
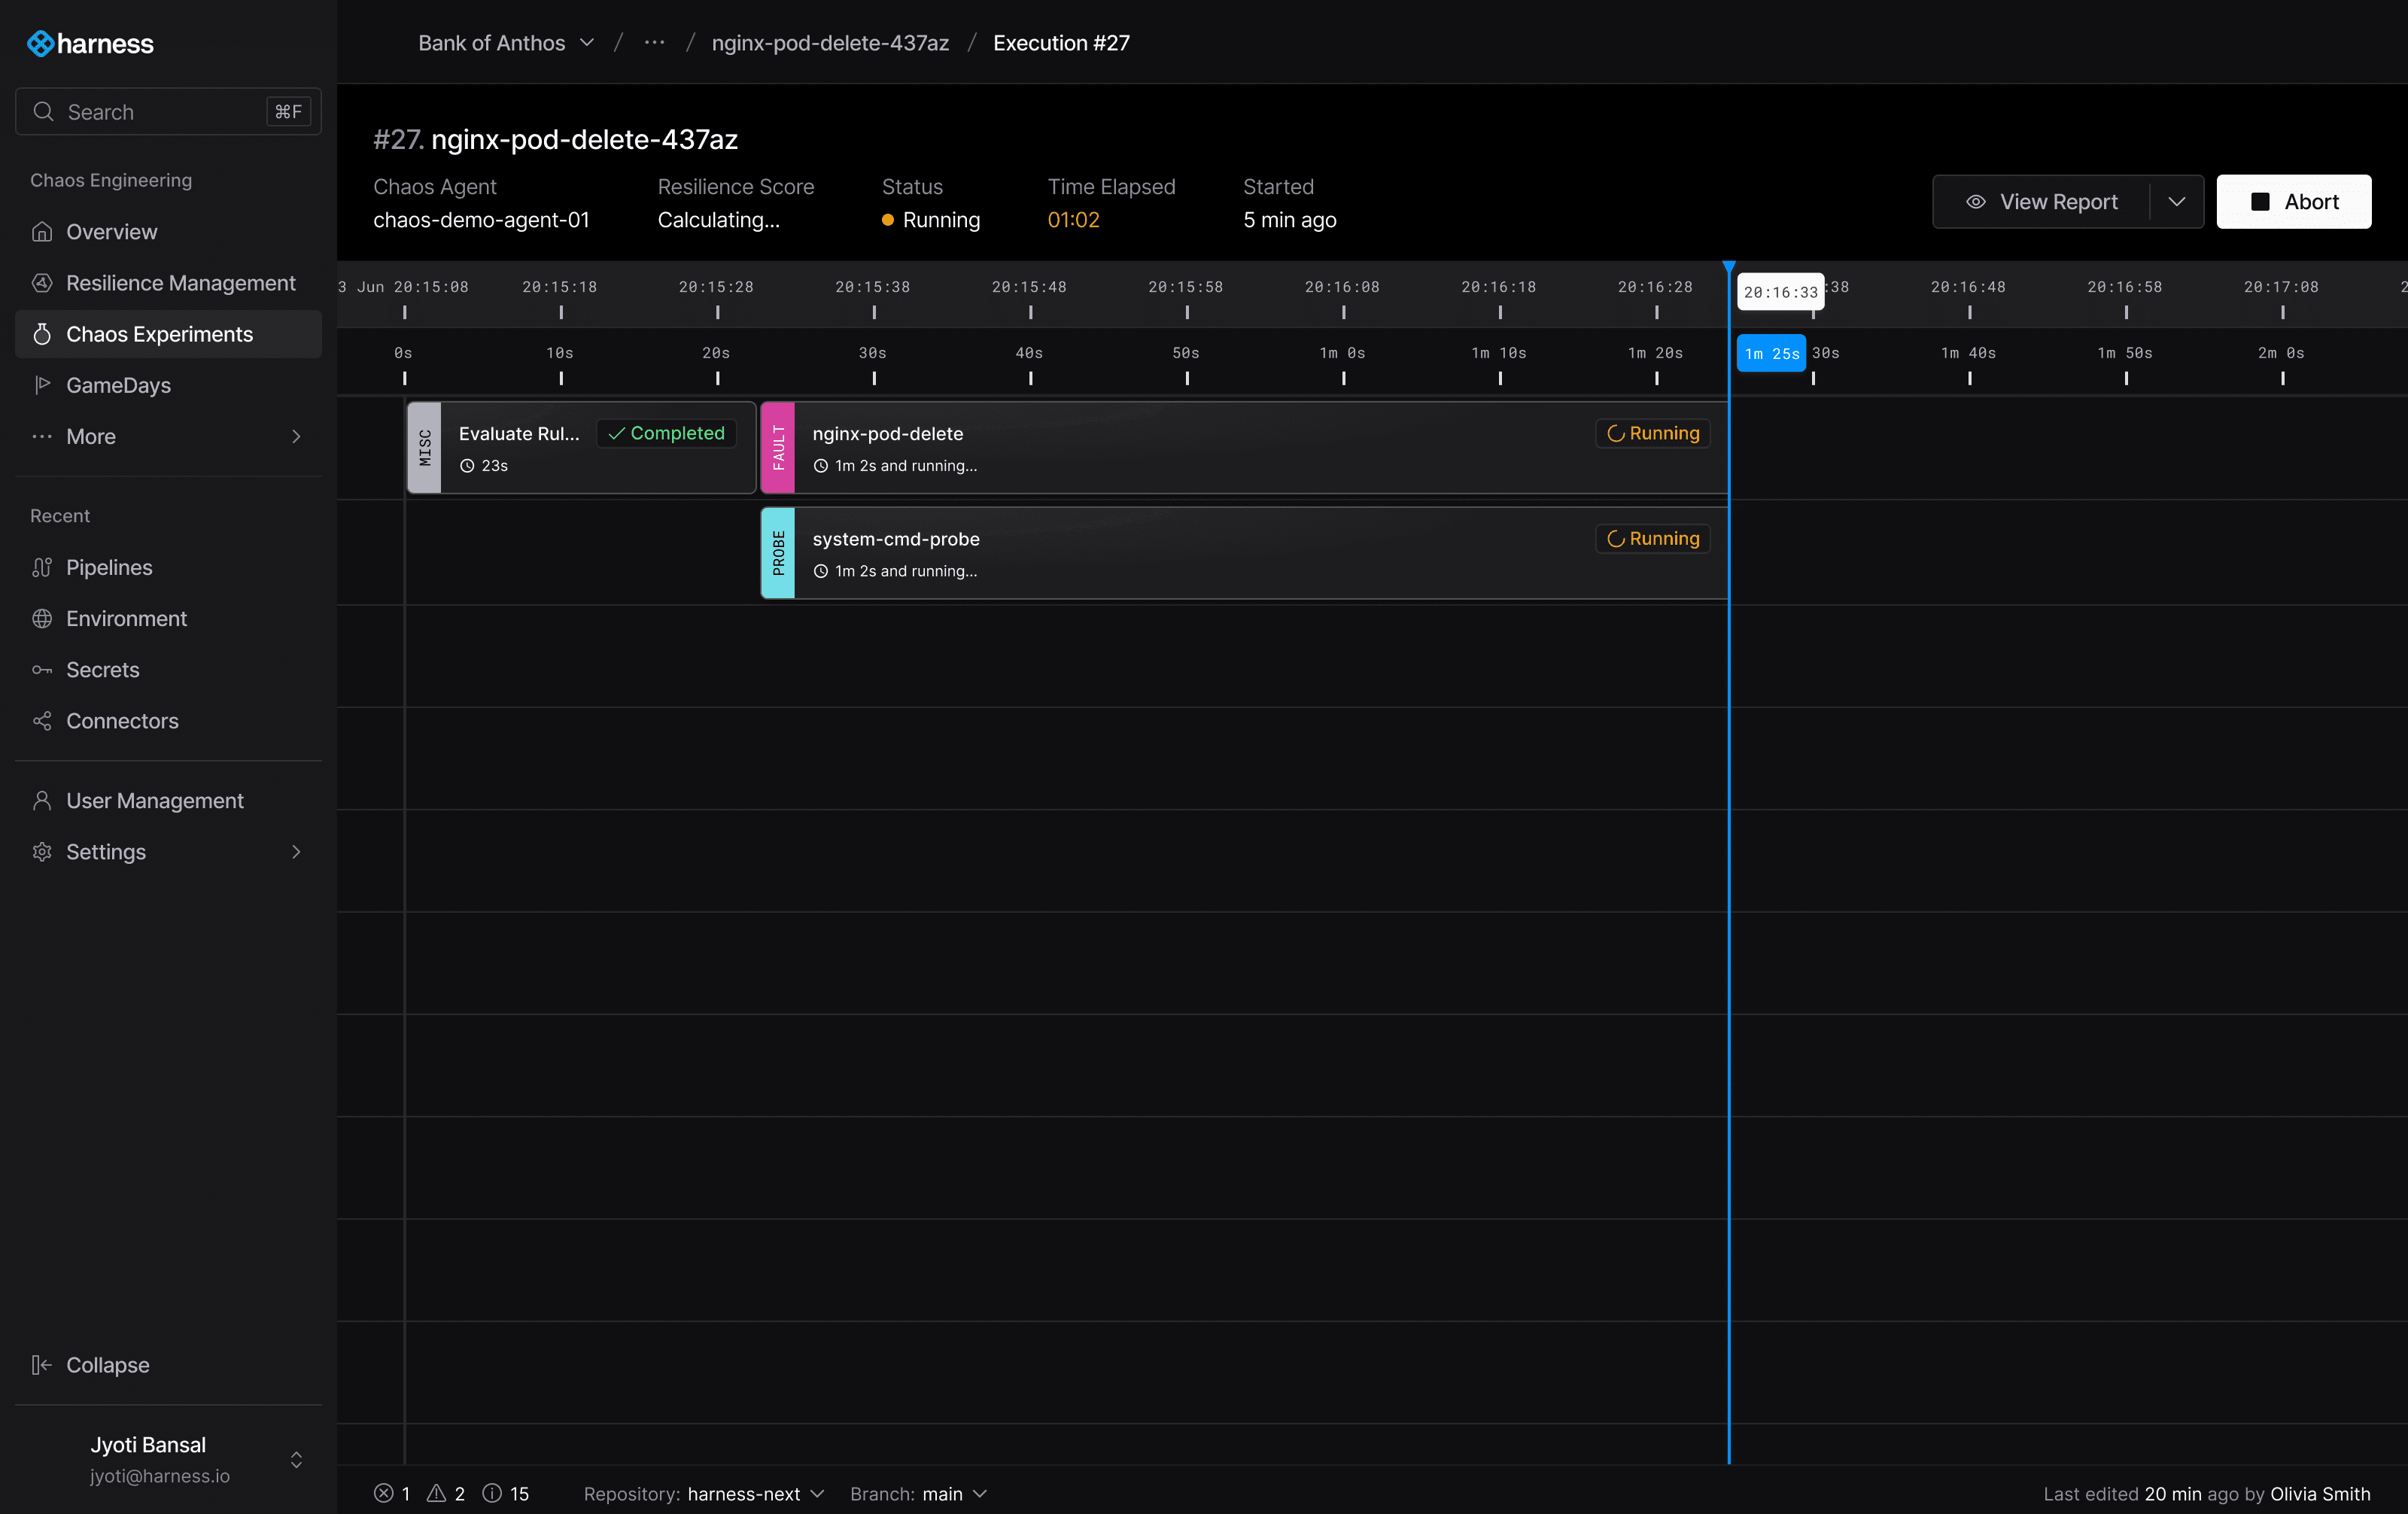
Featured an interactive timeline view of experiment execution that visualized fault injection points, system responses, and recovery patterns in chronological order, making it intuitive to correlate chaos events with system behavior and identify resilience gaps
Both interfaces leveraged machine learning to suggest contextually relevant components, parameters, and safety guardrails based on system architecture and conversation context.
Impact & Learnings
The impact was immediate and measurable: existing customers took 15 minutes to create a chaos experiment, down from an average of 2 hours. This dramatic improvement validated our multi-modal approach rather than relying solely on an AI chatbot interaction.
Key learnings emerged about interface diversity: while AI chatbots excel at guided discovery and handling ambiguous user needs, we found that most of our users preferred transitioning to the visual building blocks for actual experiment construction after starting with an initial prompt. Users also want to be able to modify their experiment without solely relying on AI. The timeline visualization proved equally important to our users as it allowed them to identify system vulnerabilities in an experiment execution.
This reinforced that AI chatbots should complement, not replace, traditional interfaces. The most successful user journeys combined conversational guidance for initial learning with visual tools for construction and analysis. This insight led to prioritization of seamless cross-interface workflows and integration points in subsequent releases.